


Whilst both Tunable Resistive Pulse Sensing (TRPS) and Dynamic Light Scattering (DLS) assess particle size, they do so in very different ways. TRPS offers a high-resolution approach to particle measurement (range: 40 nm to tenths of µm) which is gained from a particle-by-particle analysis of samples. In contrast, DLS relies on an algorithm to approximate size distribution by assuming a normal or log-normal distribution, without directly measuring individual particles. These differences in methodology make TRPS the method of choice for assessing polydisperse samples and monodisperse samples alike. Additionally, TRPS has further capabilities, as it allows you to measure size and concentration, or size and zeta potential, substantially increasing the information gained from your sample.
How exactly does the difference in methodology between DLS and TRPS impact on sample measurements? Kozak et al (2015) asked just this question.1
How does differing methodology influence TRPS and DLS sample measurements?
In a 2015 study by Kozak et al., the liposomal nanomedicine Caelyx was found to have a mean size of 84 nm with a narrow distribution using TRPS, indicating a monodisperse sample (Figure 1A).1 However, DLS reported a lower mean size of 68 nm and a much broader distribution. The authors attributed these discrepancies to the higher measurement resolution of TRPS and the algorithmic assumptions inherent in DLS. Our in-house data further supports this finding, demonstrating a similar phenomenon when measuring a polydisperse, quadrimodal sample of differently sized polystyrene particles (Figure 1B) – even when using the purportedly higher-resolution Multi-Angle DLS (MADLS). With MADLS, the four particle populations blur together, while TRPS clearly and accurately identifies each population.
How does TRPS achieve this high resolution?
TRPS offers a distinct advantage over other particle measurement methods, such as DLS, by enabling the measurement of individual particles. With TRPS, particles pass one-by-one through a stretchable nanopore. The current passing through the nanopore is continuously monitored, which means that when a particle passes through the nanopore and momentarily obstructs the current, this leads to a quantifiable change in the measured resistance and its related current. The magnitude of this blockade directly correlates with the size of the particle being analysed, allowing for precise and accurate determination of particle size.
TRPS measurements are fine-tuned using blockade readings for calibration particles with known sizes. This calibration is performed every time a TRPS instrument is utilised, ensuring the utmost accuracy. Moreover, this process can be conducted at various different pressures, confirming consistency across varying conditions and enhancing accuracy in the determination of particle number concentration.
As demonstrated in Equation 1, the change in resistance caused by a calibration particle passing through the nanopore (ΔRc) is proportional to the calibration particle volume (Vc), which is a known value. This relationship renders the calibration process particularly powerful, as it allows for the precise determination of the relationship between the blockade size (ΔR) and particle volume (V) not just in abstract but right at that moment, using that nanopore and those conditions on that machine. This means that we can work out the accurate volume of each sample particle (Vs) passing through the nanopore based upon the measured change in resistance for each sample particle (ΔRs).
Known, measured and calculated values from Equation 1a are summarised in Equation 1b.
A similar equation is used to calculate concentration, where the rate of particles passing through the nanopore is calibrated against calibration particles of a known concentration.
This calculation harnesses the use of calibration particles and the single-particle nature of TRPS to provide a powerful, accurate approach to particle analysis. With TRPS, small changes in particle size are detected easily through changes in the baseline current, making it a high-resolution technique.
The critical role of particle size in nanomedicine: unveiling the superior detection capabilities of TRPS
In nanomedicine, even slight differences in particle size can significantly affect product efficacy and safety. Given that TRPS is expected to offer greater resolution than DLS, Kozak et al. (2015) sought to determine if TRPS could detect these small yet meaningful size discrepancies.1
To investigate this, they conducted two main tests. In the first test, liposomes were extruded using either a 100 nm or a 200 nm filter and particle size distribution was then measured using TRPS. A clear distinction was observed (Figure 2); liposomes extruded through the 100 nm filter had a mean size of 130 nm, while those extruded through the 200 nm filter reached a mean size of 186 nm. Although the 130 nm size for the 100 nm filter extruded liposomes may seem unexpectedly large, it aligns with previous studies reporting a mean diameter range of 120 nm to 140 nm for liposomes produced in this manner.2
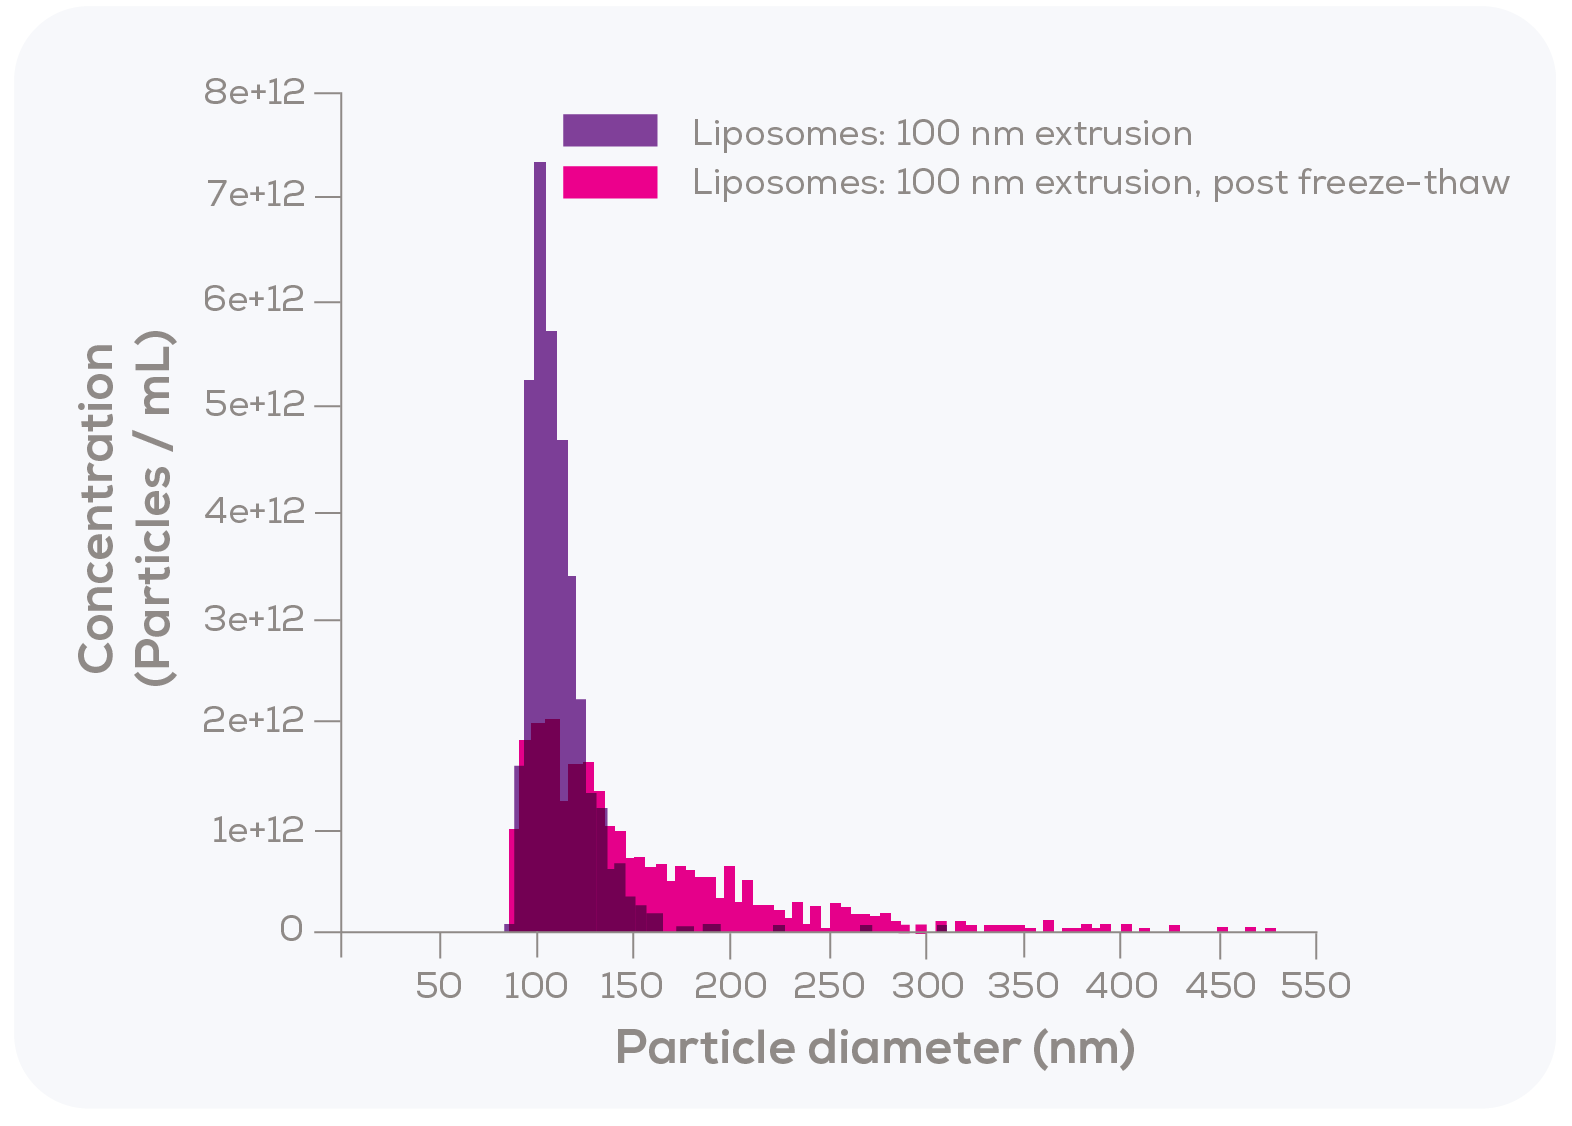
In the second test, Kozak et al. measured 100 nm filter-extruded liposomes using TRPS, both fresh and after undergoing a freeze-thaw process. As shown in Figure 3, the particle size distribution following freeze-thaw was notably broader, exhibiting a rightward tail that suggests possible aggregation or fusion.
Delving deeper into the versatility of TRPS with simultaneous size and zeta potential measurement
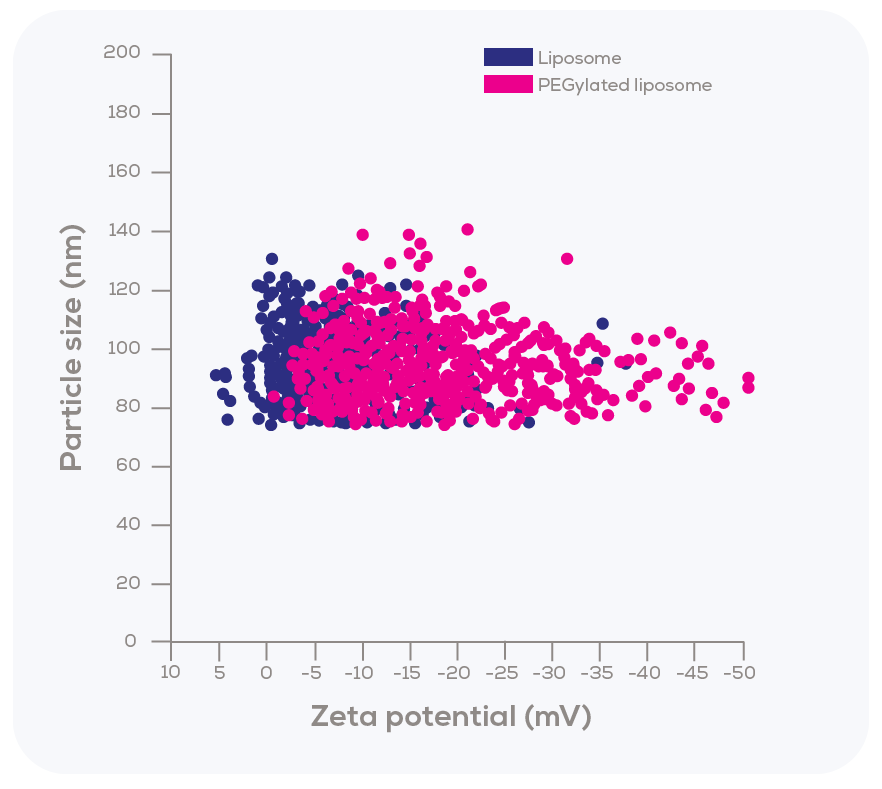
Kozak et al. explored another key feature of TRPS – its remarkable ability to measure both size and zeta potential of individual particles simultaneously as they pass through the nanopore. To investigate this aspect, the researchers modified liposomes with polyethylene glycol (PEG), which led to slight changes in size (from 90 nm unmodified to 95 nm PEGylated) and a measurable shift in zeta potential (from a mode of -2.5 mV for unmodified liposomes to -10 mV for PEGylated ones).
Interestingly, the zeta potential distribution of PEGylated liposomes was substantially broader compared to that of the unmodified liposomes. This finding suggests that the incorporation of PEGylated lipids within the sample was not uniform, demonstrating variability in the degree of PEGylation.
Unlock the full potential of TRPS: a powerful tool for the nanomedicine industry
Kozak et al. demonstrated that TRPS can effectively discern size differences between liposomes and monitor their stability, as evidenced by the freeze-thaw experiment (Figure 3). Moreover, TRPS can track nanomedicine loading – as illustrated by the PEGylation experiment – using both size and zeta potential measurements (Figure 4). This capability is especially pertinent when dealing with negatively charged components, such as mRNA. These critical examples of nanomedicine quality, stability, and loading assessments make TRPS an indispensable tool for the industry.
During the development stage, TRPS can be employed to compare various formulations and loading methods, facilitating the identification of optimal protocols for testing and production. In the production phase, TRPS serves as a vital quality control instrument, ensuring consistency between batches. With its high resolution, accuracy and particle-by-particle data, our latest TRPS instrument – the Exoid – is also well-equipped to meet stringent nanomedicine regulatory requirements.
To learn more about how the Exoid can benefit your research, we invite you to explore our article outlining the top 4 reasons to choose the Exoid. For a more visual experience, delve into our TRPS playlist on YouTube. To see the Exoid in action with your own samples, don't hesitate to contact our team, who will be happy to arrange a demo for you.
Get in touch to experience the unparalleled precision and versatility of TRPS – a game-changer for nanomedicine quality control, stability monitoring, and particle characterisation.


